2018 Diversity Impacts Across The Movement
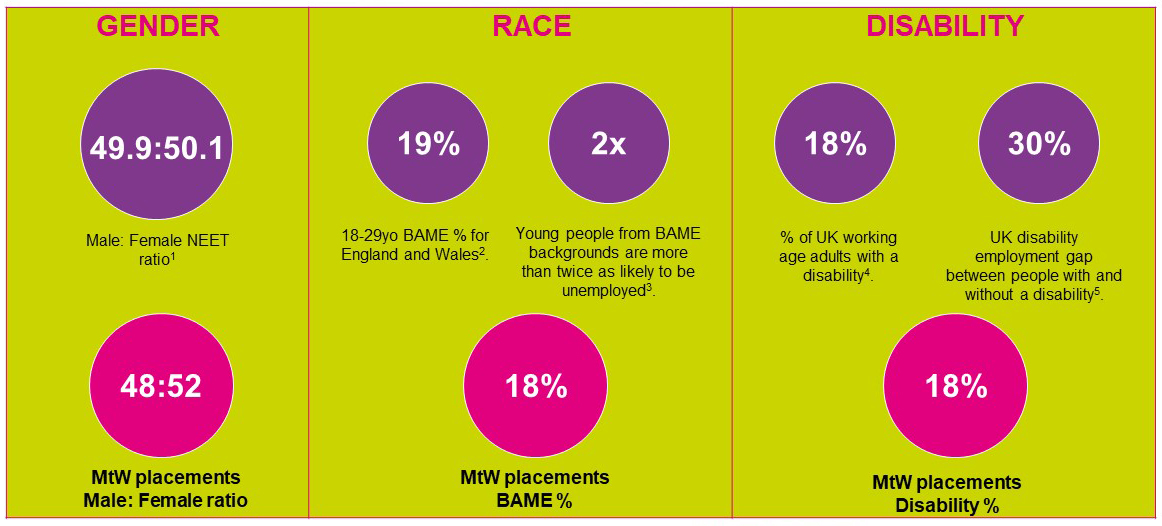
1. Taken from Not in Education, Employment or Training (‘NEET’) by age: People (seasonally adjusted), found on UK National Statistics website, published 21 May 2019
2. Calculated from 3. Age Profile by ethnicity found at Ethnicity Facts and Figures at gov.uk from England and Wales census data 2011.
3.See p27, Participation by age in the UK Government’s Race Disparity Audit, revised March 2018.
4. Family Resources Survey 2017/18
5. People with disabilities in employment, House of Commons Library, published May 17 2019
6. Data collected from 15 companies: Accenture, BAE, Barclays, BHF, BT, BUPA, Centrica, Civil Service, Diageo, IBM, M&S, NHS, Starbucks, Tesco (2017), Unilever
Regional Impact 2018 – Movement To Work
Region |
MtW Placements % |
NEET numbers (Rate)1 |
Claimant count (18-29)2 |
Social Mobility coldspots3 |
| London | 9% | 121,000 (13.3%) | 44,000 | 0 |
| South East | 5% | 79,000 (8.8%) | 31,000 | 0 |
| South West | 8% | 60,000 (10.7%) | 22,000 | 2 |
| East of England | 6% | 56,000 (9.5%) | 24,000 | 2 |
| East Midlands | 8% | 52,000 (10.1%) | 23,000 | 10 |
| West Midlands | 12% | 84,000 (13.1%) | 17,000 | 2 |
| Wales | 3% | 47,400 (14%) | 8,000 | 0 |
| Yorks & Humber | 10% | 66,000 (11%) | 14,000 | 1 |
| North West | 23% | 90,000 (11.8%) | 21,000 | 3 |
| North East | 9% | 43,000 (15.2%) | 10,000 | 0 |
| Scotland | 5% | 14,000 | 0 | |
| N Ireland | 2% | 21,000 (10%) | 4,000 | N/A |